Bathymetric mapping, the measurement and mapping of the depth and shape of the seafloor, still has a long way to go. Less than a third of the ocean floor has a detailed map: according to Seabed 2030, the global effort to map the entire seabed, the figure reached 28.7% in 2026. In fact, we know the surface of Mars better than the bottom of our own oceans.
But there is a second problem that gets less attention. Even the parts of the seabed that surveyors have covered are rarely complete. Open almost any high-resolution seafloor map and you will find holes: stripes, patches and blank areas where there is simply no data.
In this article we explain how bathymetric mapping works, why it is so hard to map the ocean floor completely, why the maps end up with gaps, how those gaps have traditionally been filled, and how AI is now able to reconstruct the missing terrain far more convincingly. We also share what we learned doing exactly this for a seafloor mapping company.
How Bathymetric Mapping Works
Bathymetric mapping, often simply called bathymetry or seafloor mapping, is the measurement of water depth across an area, turned into a map of the shape of the seabed. Think of it as a topographic map, but underwater. Surveyors usually store the data as a grid of depth values, often in a GeoTIFF file, that GIS software can display as a shaded relief or a colour-coded depth chart.
There are four main ways to collect it:
- Multibeam sonar: a ship sends out a fan of sound pulses and measures how long the echoes take to return. Each pass maps a strip of seabed called a swath. This is the standard for detailed bathymetric surveys.
- Single-beam sonar: a single depth reading straight below the boat. It is cheap and common on fishing and recreational boats, but it only measures a line, not an area.
- Airborne lidar: an aircraft fires green laser pulses that pass through the water and bounce off the bottom. It is fast and excellent for coastlines, but it only works in shallow, clear water.
- Satellites: some satellites estimate shallow depths from the colour of the water, while others measure tiny bumps in the sea surface caused by the gravity of underwater mountains. NASA’s SWOT satellite uses this to map the deep ocean, but at a much coarser resolution than sonar.
However, each bathymetric mapping method has blind spots, and those blind spots are where the holes come from. NOAA’s ocean mapping explainer is a good starting point if you want to go deeper into the equipment itself.
Does Google Earth Show the Ocean Floor?
Yes. Zoom into any ocean in Google Earth and you will see mountains, trenches and ridges on the seabed. However, most of what you see is not a detailed survey. Across the open ocean, the seafloor in Google Earth comes from global compilations of depth data, largely estimated from satellite measurements of the sea surface, with features only a few kilometres across or larger.
Look closely and you will often notice sharper, straight strips running across the smoother background. Those are ship tracks: lines where a research vessel actually surveyed the seabed with multibeam sonar. They show the gap between estimated and measured depth very clearly, and they are a good reminder of how little of the ocean has a detailed bathymetric map.
Why Is It So Hard to Map the Ocean Floor?
Mapping the ocean floor is hard because you cannot see it. Light fades within a few metres to a few tens of metres of water, so almost everything relies on sound, lasers in clear shallow water, or indirect satellite measurements. Even where surveys exist, they are rarely complete. Mappers call the gaps in bathymetry data voids. They are not mistakes. Instead, they are a natural result of how seafloor mapping collects data. The most common causes are:
1. Gaps between survey lines
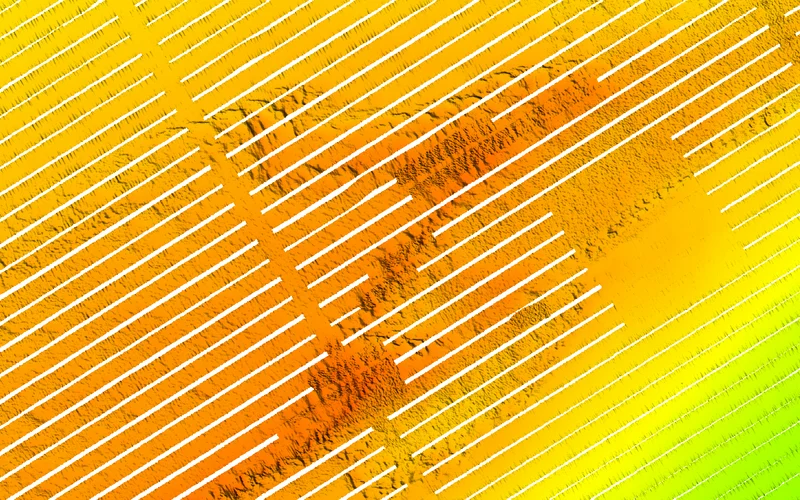
A multibeam swath is only a few times wider than the water is deep. In 20 metres of water, one pass might cover around 60 to 100 metres of seabed. To cover an area completely, the boat has to drive overlapping lines, like mowing a lawn. Wind, currents, time pressure or a missed line leave long, narrow strips of seabed with no data between the passes. This is the most common type of void in real surveys.
2. Shallow, murky or cloudy water
Lidar and satellites need to see the bottom. Murky water, waves, sun glint and cloud cover all block the signal, leaving patches with no depth readings. In very shallow water, boats often cannot go at all.
3. Acoustic shadows
Sound travels in straight lines. Behind a tall rock, wreck or steep ledge there can be a “shadow” where the sonar never reaches the seabed, especially at the outer edges of the swath.
4. Bad readings that get removed
Air bubbles, fish schools, rough seas and engine noise all create false echoes. During processing, analysts clean out these readings, and what remains is a hole.
5. Time and money
Survey vessels cost thousands of dollars per day to run. As a result, going back to fill every small gap is rarely worth it, so the gaps stay in the final map.
Why Gaps in Bathymetric Mapping Matter
A few missing stripes might not sound like a big deal, but they cause real problems for everyone who relies on bathymetric mapping:
- Anglers and divers lose exactly the features they are looking for. A ledge or reef that runs through a void simply disappears from the chart.
- Engineers planning cables, pipelines or offshore wind farms need a continuous surface to calculate slopes and routes.
- Scientists modelling currents, sediment, habitats or tsunamis need complete grids. Most models cannot handle “no data” cells.
- Map products look unfinished. Blank stripes make an otherwise detailed chart look broken to customers.
Traditional Ways to Fill Gaps in Bathymetric Mapping
There are three common approaches, and each has trade-offs:
- Re-surveying: going back out to measure the missing areas. It is the most accurate option, but also the slowest and most expensive, and it is often impossible after the fact.
- Interpolation: estimating the missing depths from the surrounding values, with methods such as inverse distance weighting, splines or kriging. It is fast and works well for small holes, but across larger gaps it produces flat, smooth surfaces that blur away ridges, ledges and rocks.
- Blending with a coarser dataset: filling the holes with a lower-resolution global grid such as GEBCO. This gives a complete map, but the filled areas have far less detail than the rest and the edges are often visible.
The core problem is that none of these methods knows what a seabed looks like. They can only average the numbers around the gap.
How AI Fills Gaps in Bathymetric Mapping Data
AI approaches the problem differently. Instead of averaging nearby values, this approach trains a model on large amounts of real terrain until the model learns how landscapes are shaped: how ridges continue, how slopes change and what texture different types of seabed have. When it sees a gap, it generates the terrain that most plausibly belongs there, based on everything around it.
This is the same idea as the “remove object” or generative fill tools in photo editors, a technique called inpainting, applied to depth data instead of pixels. The models that work best today are diffusion models, the same family of AI that powers modern image generators. They start from noise and refine it step by step until the result fits seamlessly with the real data around the hole.
In practice, an AI void-filling workflow looks like this:
- Prepare the survey: split a large survey into tiles and normalise the depths so the model sees consistent values.
- Mark the voids: create a mask showing exactly which cells are missing.
- Reconstruct: the model fills only the masked cells and leaves every real measurement untouched.
- Stitch and blend: average the overlapping tiles and smooth the seams so no edges show.
- Export: write the result back as a georeferenced file, ready for charting software or any GIS.
However, the key detail is to train the model on data that looks like yours. A model trained on land elevation and neat square holes will struggle with underwater terrain and long diagonal survey gaps. Fine-tuning it on real bathymetry with realistic void shapes makes a huge difference.
Where This Fits in GeoAI
Filling seafloor voids is one example of GeoAI, or geospatial AI: applying machine learning to maps, satellite images, elevation models and other location data. Other common uses include detecting buildings and roads in aerial images, classifying land cover, predicting flood areas and optimising delivery routes.
What these projects have in common is that the data has a location attached, so the AI has to respect coordinates, projections and file formats used in GIS. If you are new to GIS, our article on the power of GIS software covers the basics.
A Real Example: Filling Gaps for StrikeLines
We recently did this for StrikeLines, a Florida-based company that turns sonar surveys into high-resolution seafloor maps for fishing, diving and marine professionals. Anglers use their charts to find reefs, ledges and hardbottom offshore. Their surveys had the classic problem: long diagonal stripes of missing data between survey passes.
Rather than training a model from scratch, we took a published diffusion model for elevation void filling and fine-tuned it on StrikeLines’ bathymetry, using training masks shaped like their real survey gaps. We then built a tiled pipeline that processes full GeoTIFF surveys and stitches the results back together without visible seams.
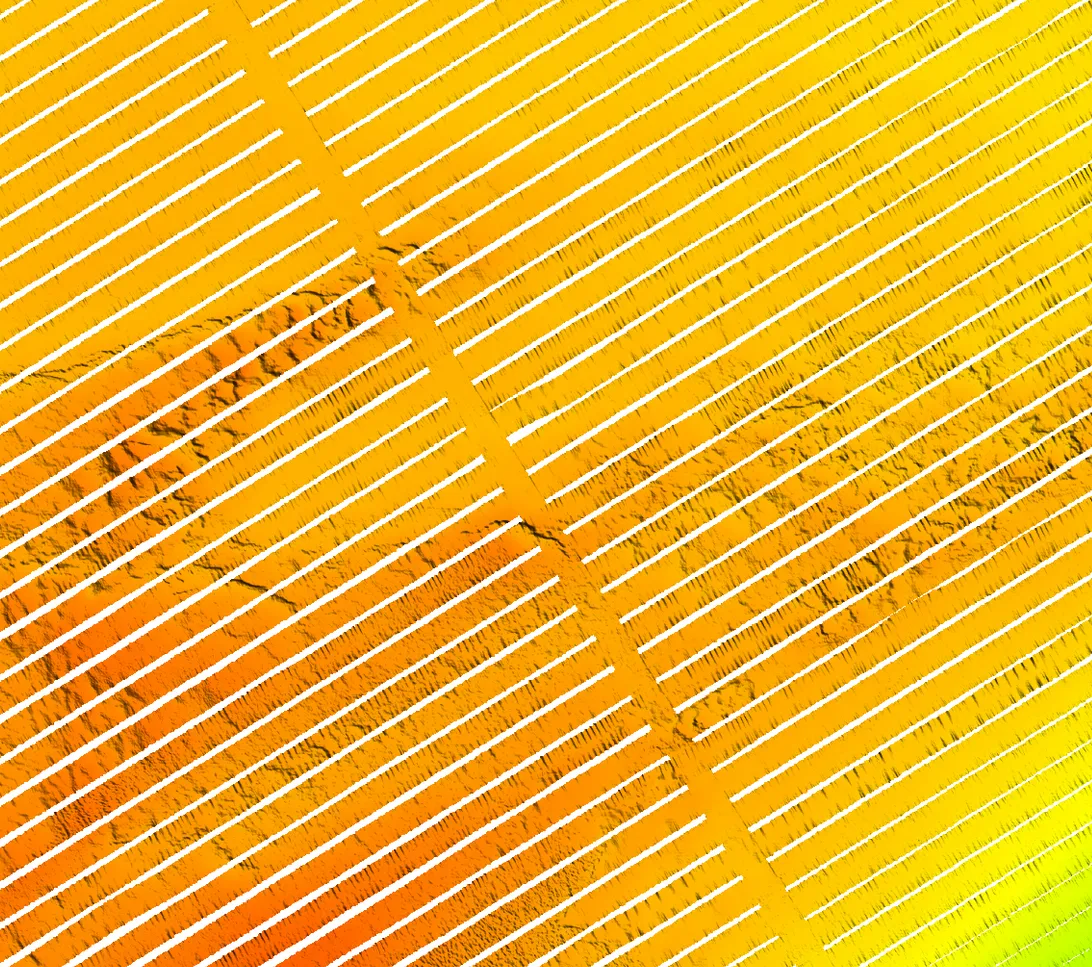
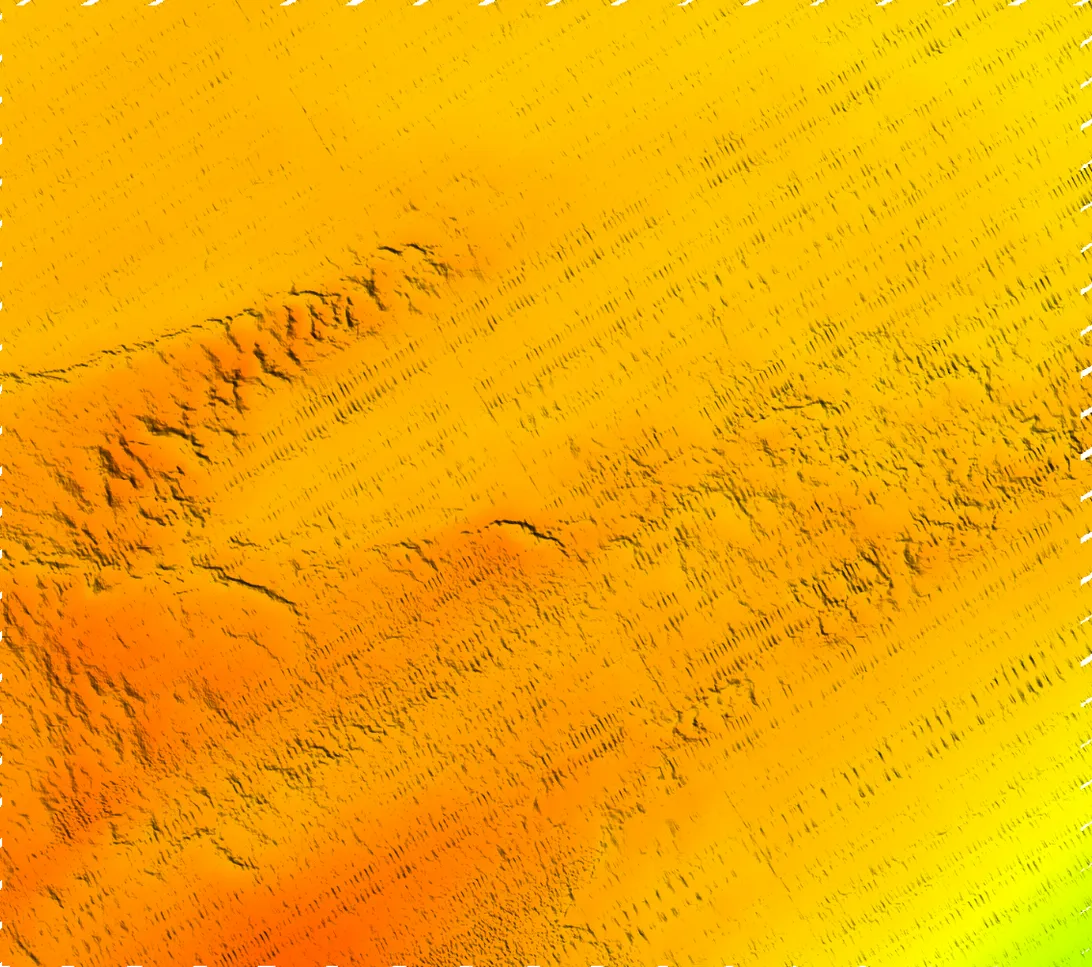
You can compare the results yourself with the interactive before-and-after sliders in our AI bathymetry void filling case study.
Can You Trust AI-Filled Seafloor Maps?
In bathymetric mapping, AI-filled areas are realistic, but they are still estimates, not measurements. We recommend a few simple rules:
- Keep the mask. Always store which cells were measured and which were reconstructed, so users can tell them apart.
- Do not use filled areas for navigation safety. For charts that ships rely on to avoid running aground, verify reconstructed depths first.
- Test on known data. Hide parts of a complete survey, let the model fill them and compare the result with the real depths. That way you can see how accurate it is on your type of seabed.
- Use it where it adds value. Visual charts, fishing and diving maps, planning, habitat studies and small gaps that are not worth re-surveying are all excellent fits.
Bathymetric Mapping: Frequently Asked Questions
According to Seabed 2030, about 28.7% of the global seafloor had been mapped in high resolution by 2026, covering roughly 104 million square kilometres. The rest is known only from coarse satellite estimates.
Most detailed seafloor mapping is done with multibeam sonar from ships, which measures depth using sound. Shallow, clear coastal waters can be mapped with airborne lidar, and satellites provide coarse estimates of the deep ocean by measuring the shape of the sea surface.
Yes, but only in shallow, clear water. Bathymetric lidar uses green laser light that passes through water, so it works well along coastlines, reefs and rivers. In deep or murky water the light cannot reach the bottom, so sonar is used instead.
Gaps, or voids, appear between sonar survey lines that did not fully overlap, behind tall seabed features that block the sound, in murky or cloudy areas where lidar and satellites cannot see the bottom, and where bad readings were removed during processing.
A topographic map shows the height and shape of land above sea level, while a bathymetric map shows the depth and shape of the ground under water. Both use contour lines or colour shading, and bathymetric maps are often called the underwater version of topographic maps.
Yes. Google Earth shows the ocean floor, but most of it is a coarse global model estimated from satellite data. Only the areas surveyed by ships, visible as sharper straight strips, show detailed measured bathymetry.
A bathymetric survey measures water depth across an area, usually with sonar or lidar, to produce a map of the seabed. It is used for charting, dredging, construction, offshore energy, science and fishing maps.
Yes. AI models such as diffusion models can reconstruct missing seafloor terrain from the surrounding data, producing realistic ridges and textures instead of the smooth surfaces created by interpolation. The filled areas are estimates and should be marked as such.
Need Help With Your Survey Data?
We provide GIS software development, from map-based apps to custom geospatial AI models for elevation, bathymetry and satellite data. If your seafloor maps or elevation models have gaps, or you have spatial data that could be doing more for your business, we can help.
- Fill voids in bathymetry, DEM and lidar data with AI tuned to your surveys
- Build processing pipelines for large GeoTIFF and raster datasets
- Create web and mobile map apps that put your data in front of customers
Take a look at our StrikeLines case study or GIS software development services, or get in touch to talk about your project.